Our approach The protocol Methodology Our sites Our sectors Commitment The 3 plans
The Biodiversity Observatory

See, listen,
measure life.

What your site really harbours, measured over time.

Assess my site
Species detected
Meles meles — European Badger
Château La Peyruche · 21h18 · 30 April 2025

The biodiversity of your site is a precious asset. Every1Counts helps you measure, understand and enhance it.

Continuous data Auditable Scientifically robust
What this changes

You move from intention to proof: every environmental commitment becomes measurable and communicable.

What this changes for you

Valorise, decide, prove, justify.

Measuring biodiversity is not enough: the data must also serve your commitments. The Observatory is designed to answer the four questions asked by your clients, partners and regulations.

The Every1Counts Report
A periodic inventory report of your ecosystem: species present, biodiversity and balance indicators, long-term trends, management recommendations.
Multiple indicators, not a single score
Biodiversity is complex. We produce a dashboard of complementary indicators (species richness, evenness, temporal stability, notable species) — in line with European scientific and regulatory recommendations.
Auditable and verifiable data
Every observation is timestamped, geolocated, and identified by our ecology experts. Your data belongs to you, exportable and usable for your reporting (CSRD) and the monitoring of your obligations (ERC).
01
Valorise — Show what your site really harbours.
Unsuspected species, captured night and day. Concrete evidence of the richness of your land, available for your clients, communications and environmental certifications.
Communication Certifications Differentiation
02
Decide — Steer your practices with real data.
Identify imbalances, understand your site's ecological corridors, measure the real impact of each development before investing in the next.
Habitat management Impact of practices
03
Prove — Demonstrate the effect of your commitments.
Are your practices really working? The Every1Counts Report measures, year after year and with verifiable data, the impact of your practices on biodiversity.
Multi-year monitoring Auditable data
04
Justify — Document your regulatory obligations.
CSRD, ERC, biodiversity reporting: the Every1Counts Report produces the structured data you need for your reports, certifications and investors.
CSRD ERC ESG Reporting
Field observations

Every species present on your site
is an indicator of the health of your ecosystem

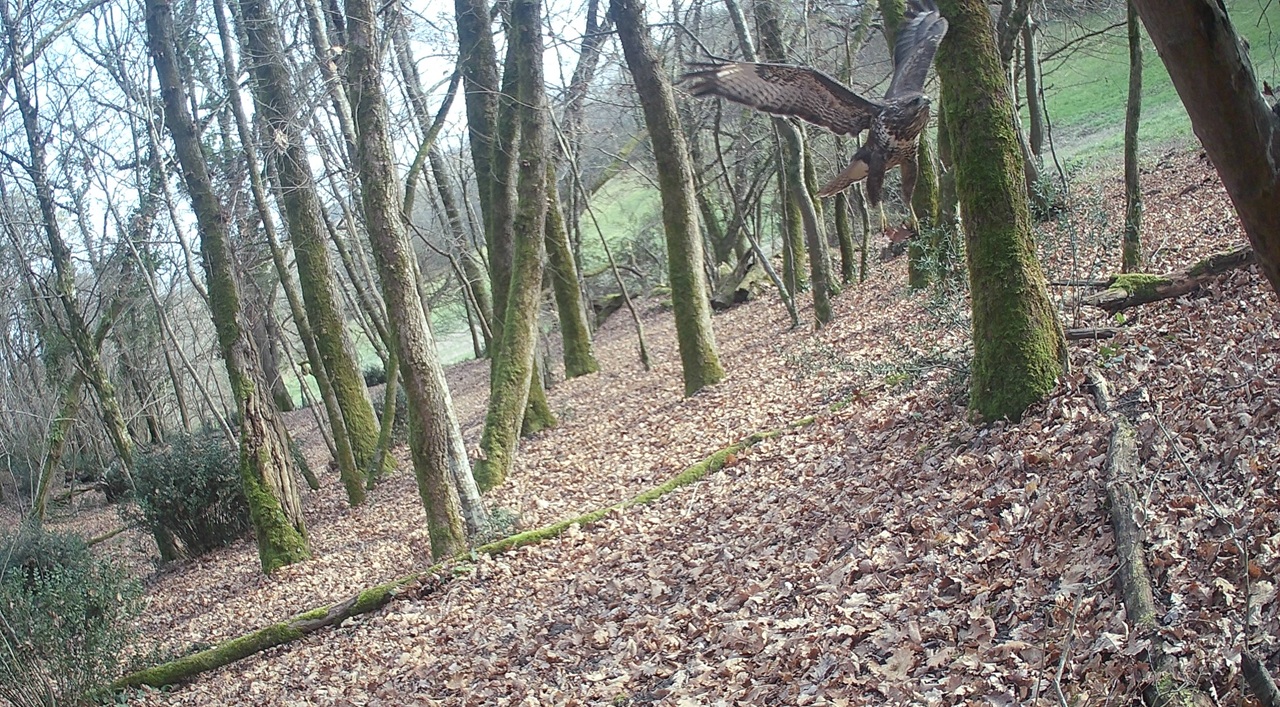
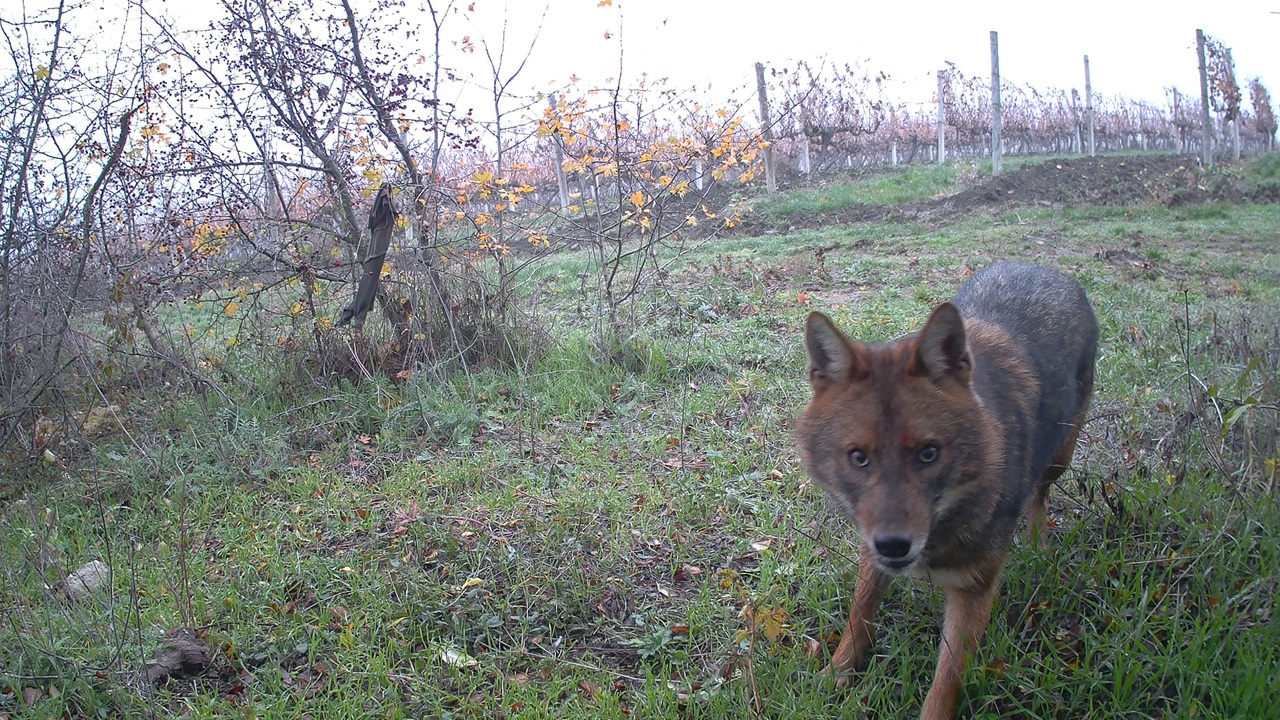
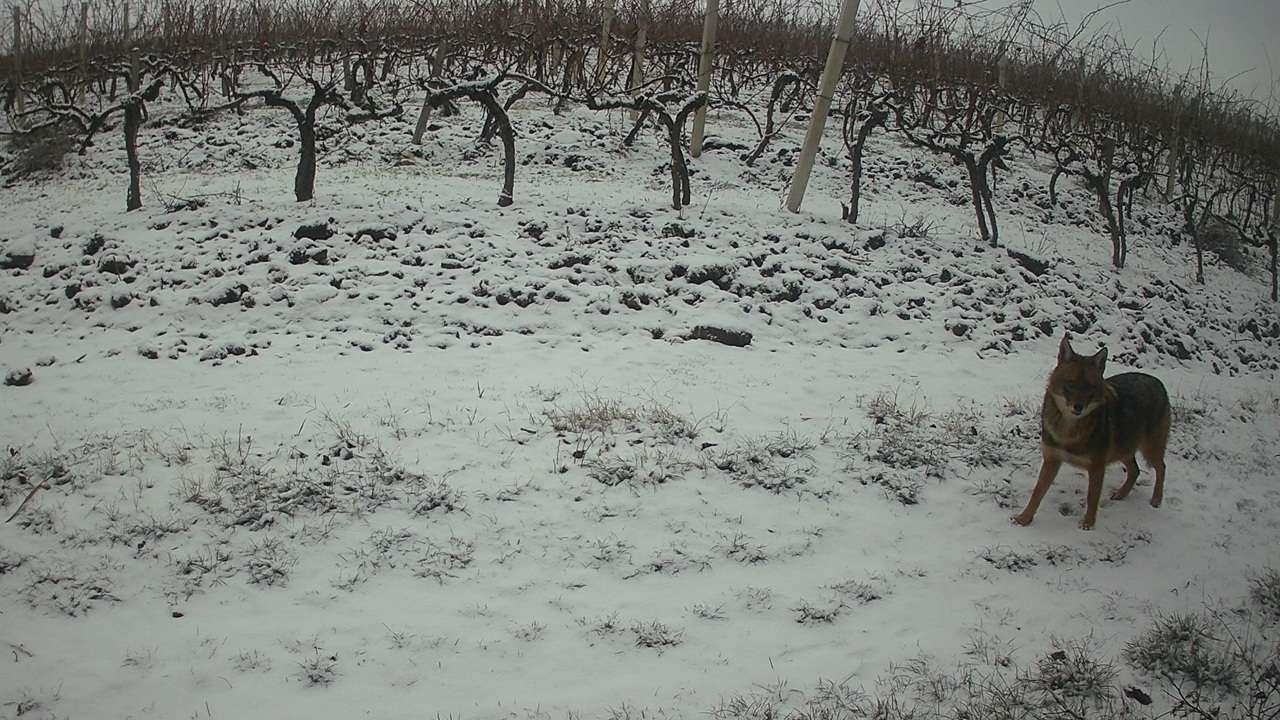
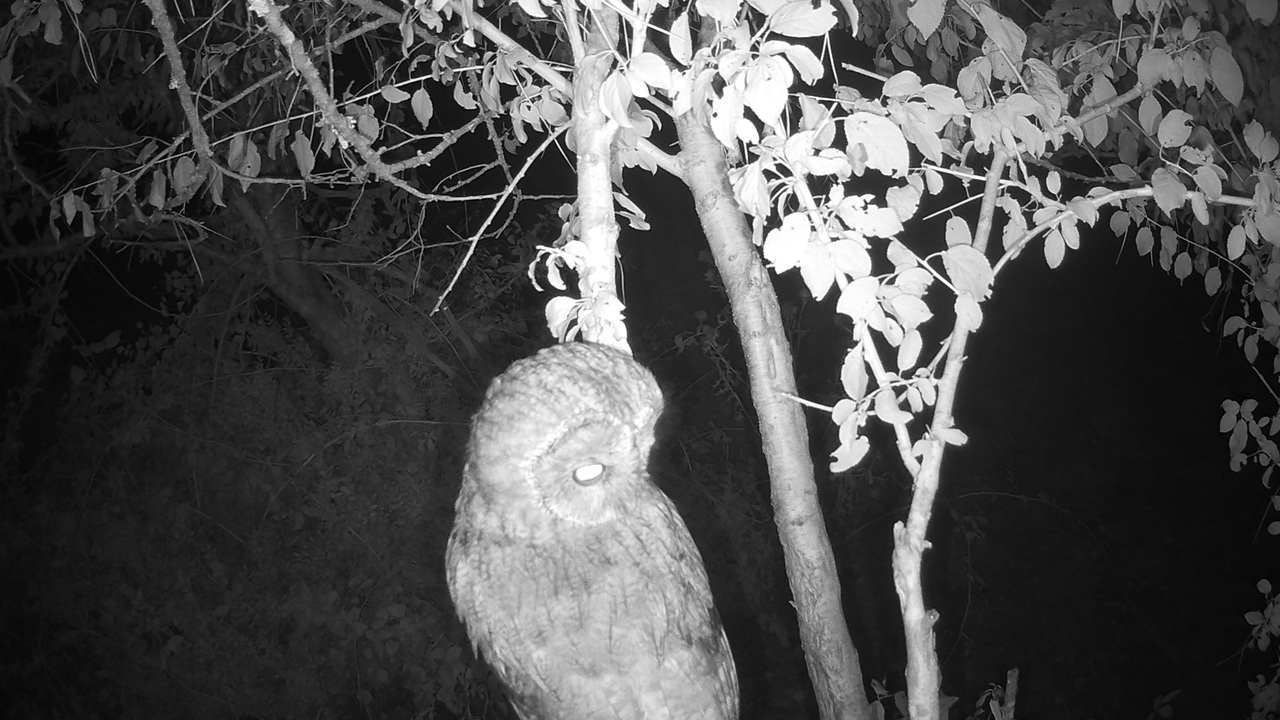
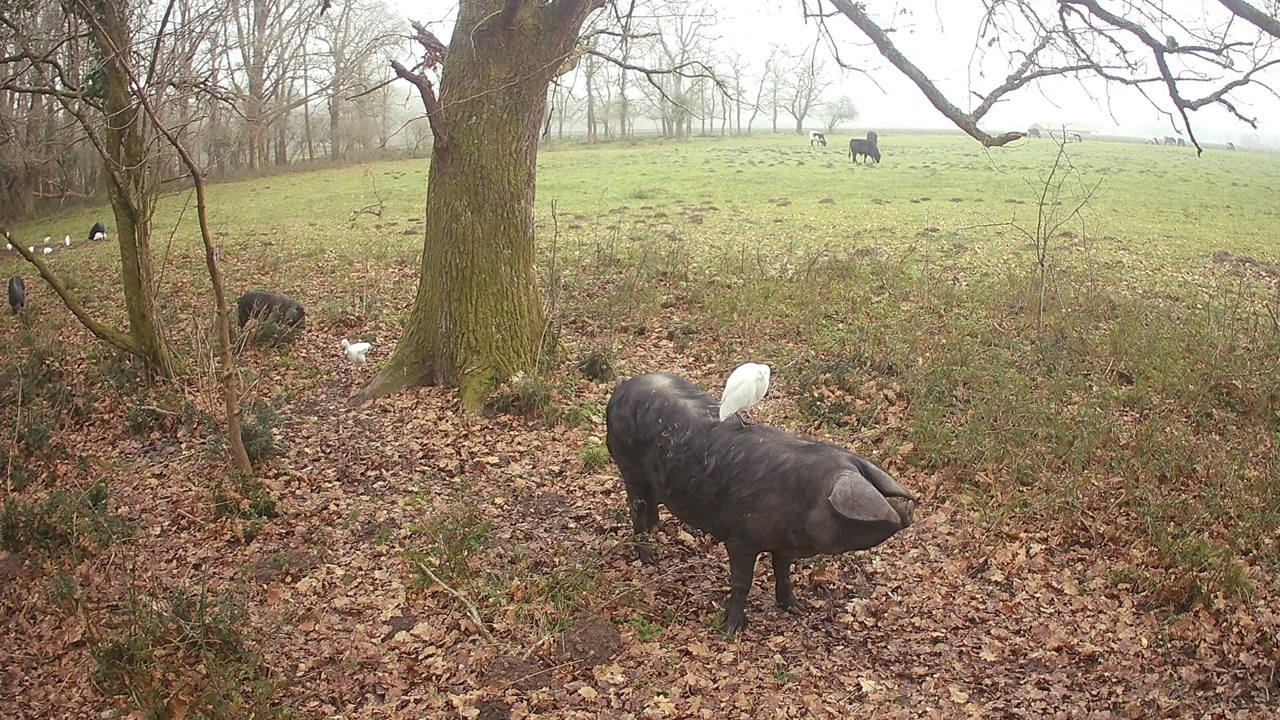
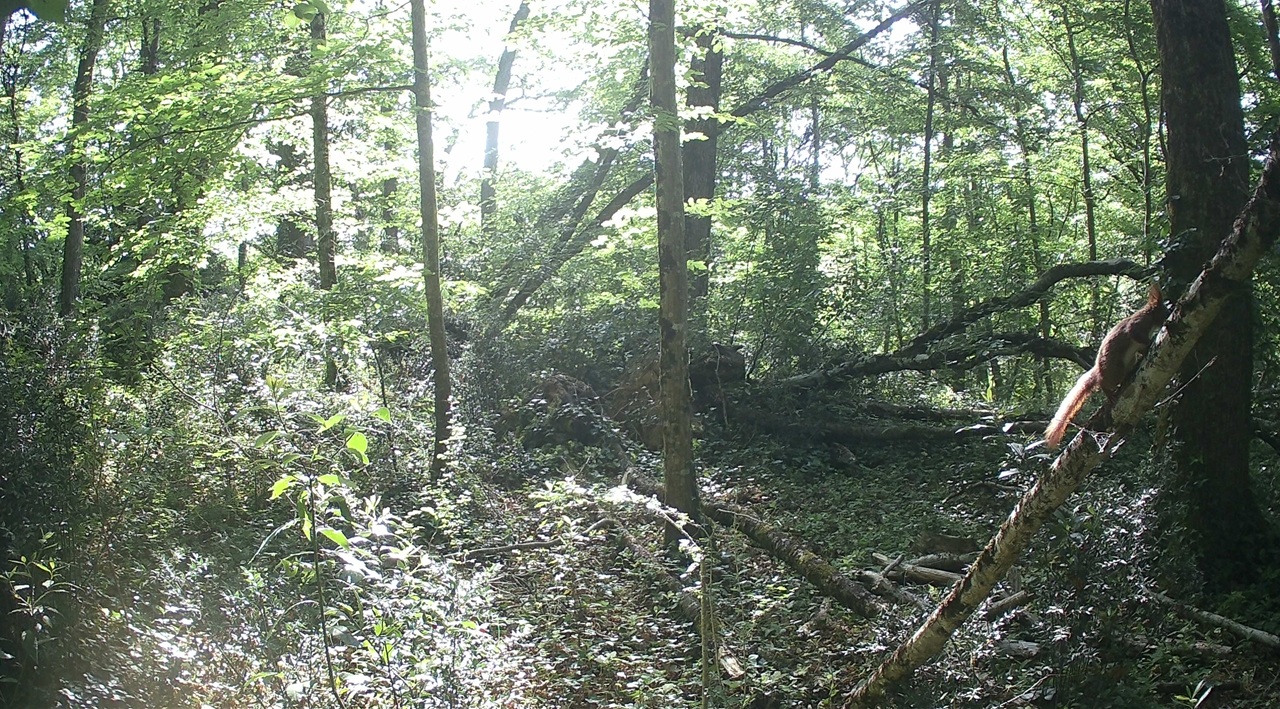
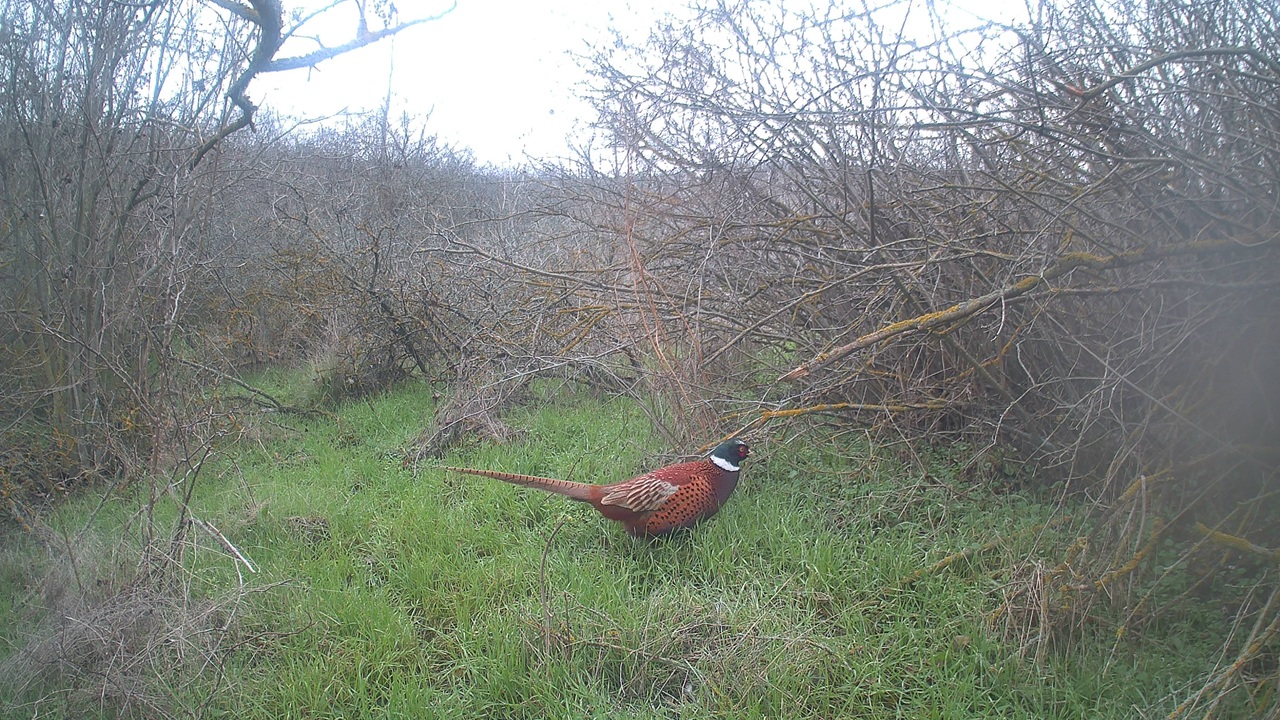
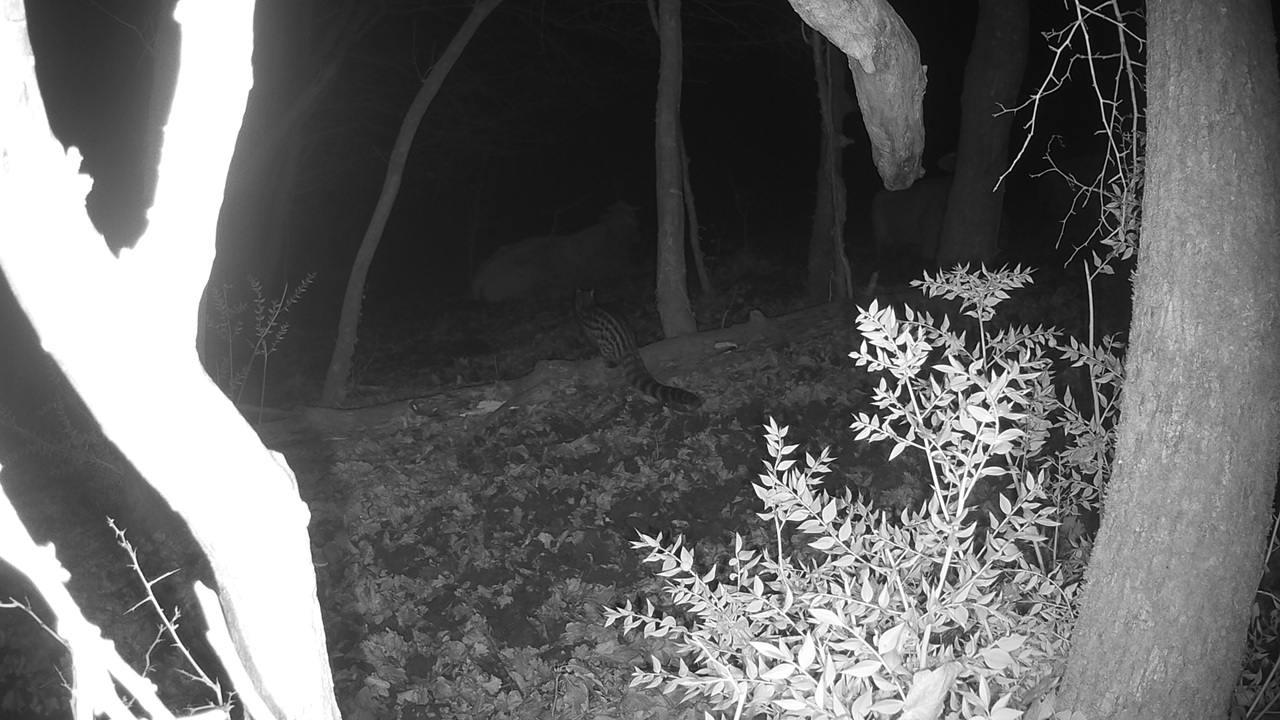
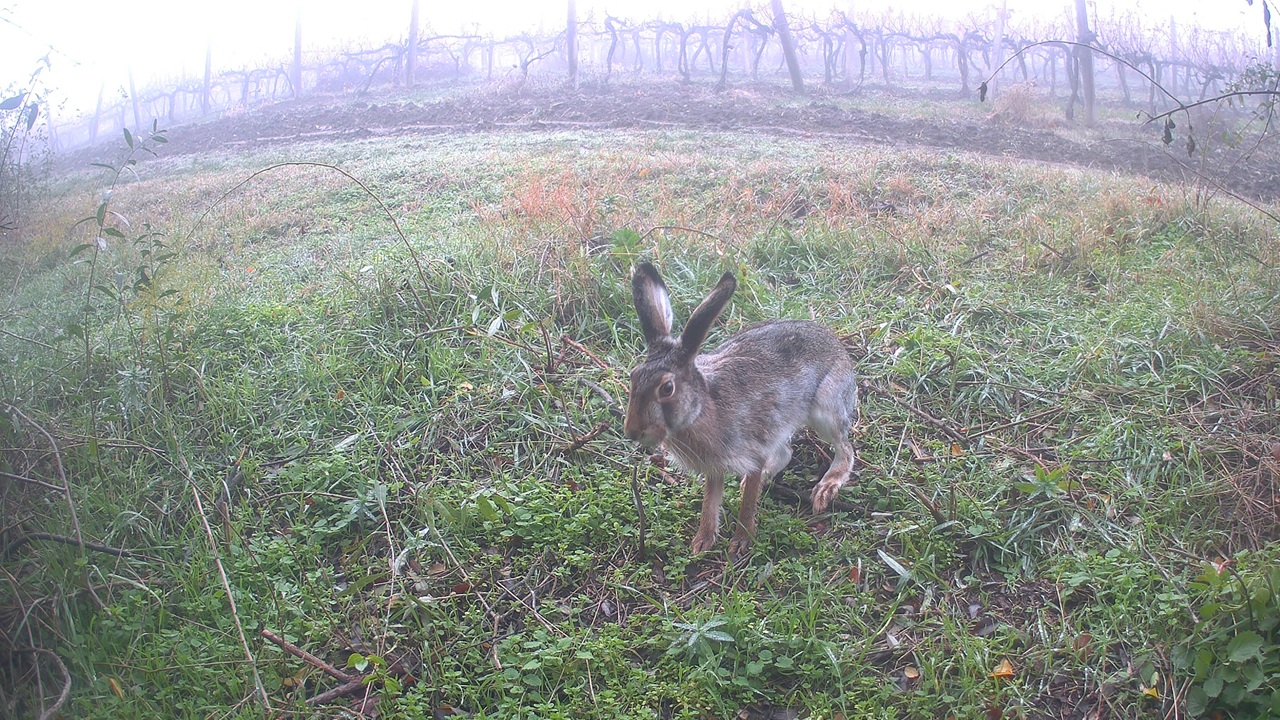
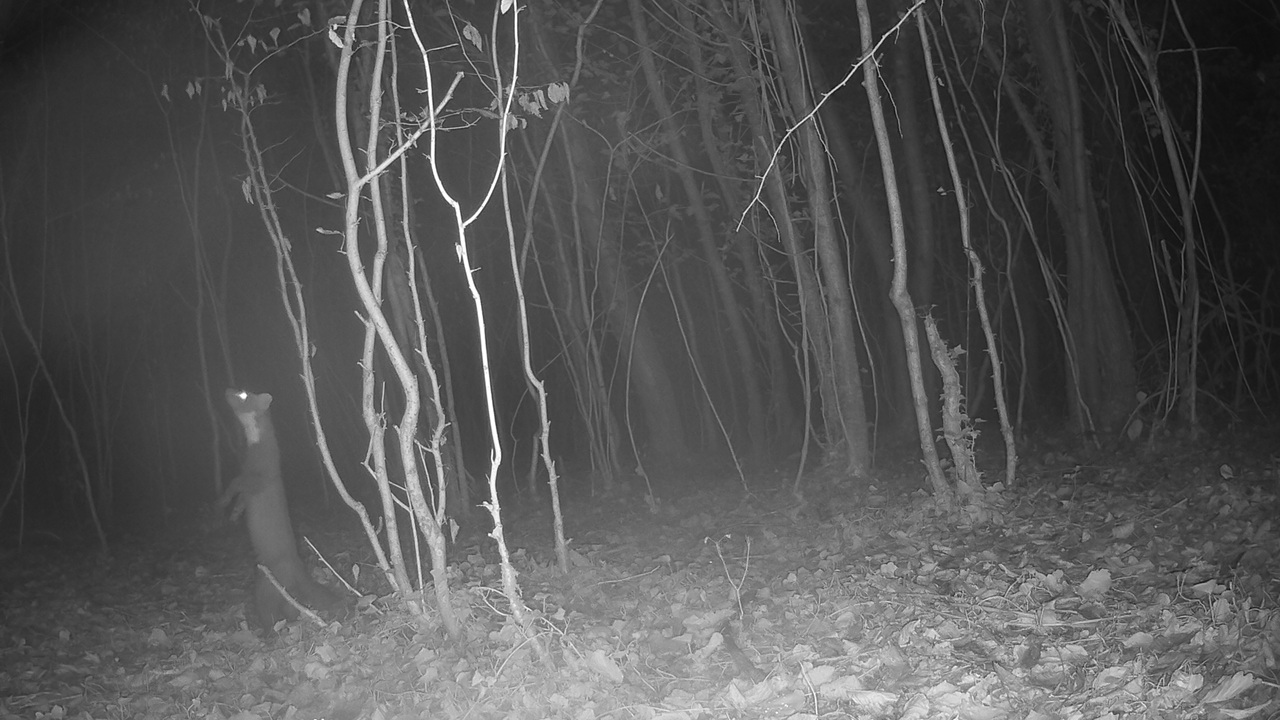
These sequences were captured by camera traps, timestamped and geolocated at our clients' sites — day and night, all year round.

Genetta genetta — Common Genet
La Peyruche · 01h20 · Jan 2025
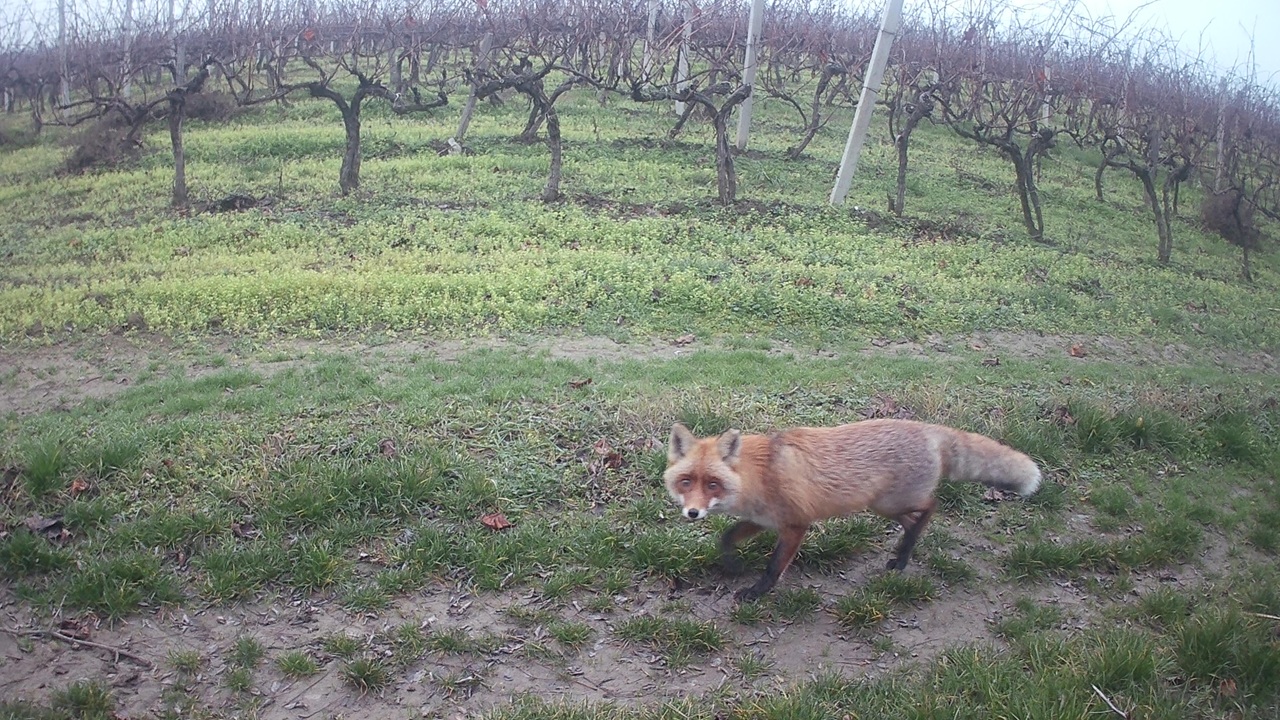
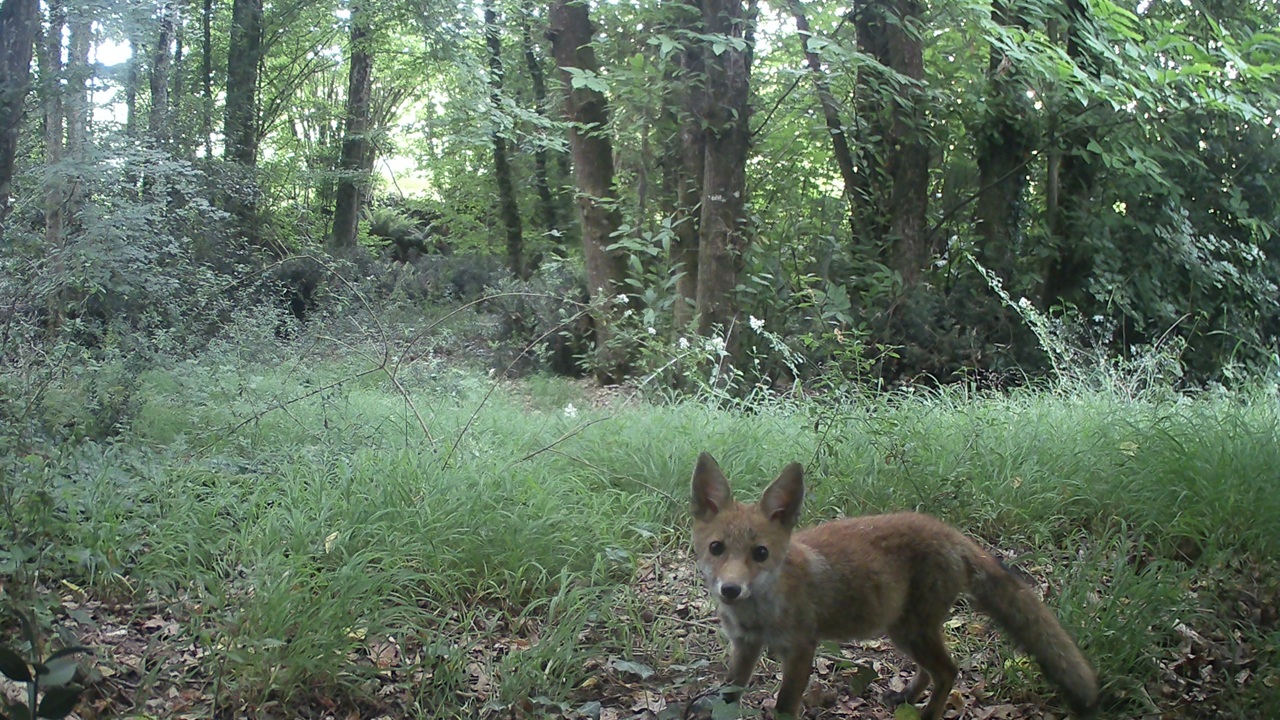
Vulpes vulpes — Red Fox
Ch. Louise de La Vallière · 16h50 · Nov 2025
Canis aureus — Golden Jackal
Purcari · 12h38 · Mar 2026
Capreolus capreolus — Roe Deer in forest
La Peyruche · 20h43 · May 2025
Sus scrofa — Wild Boar
Ch. Louise de La Vallière · 18h20 · Feb 2025
How does it work?

From your land
to your report.

Every1Counts deploys, collects, analyses and reports. You receive a structured, auditable, immediately usable Report.

01
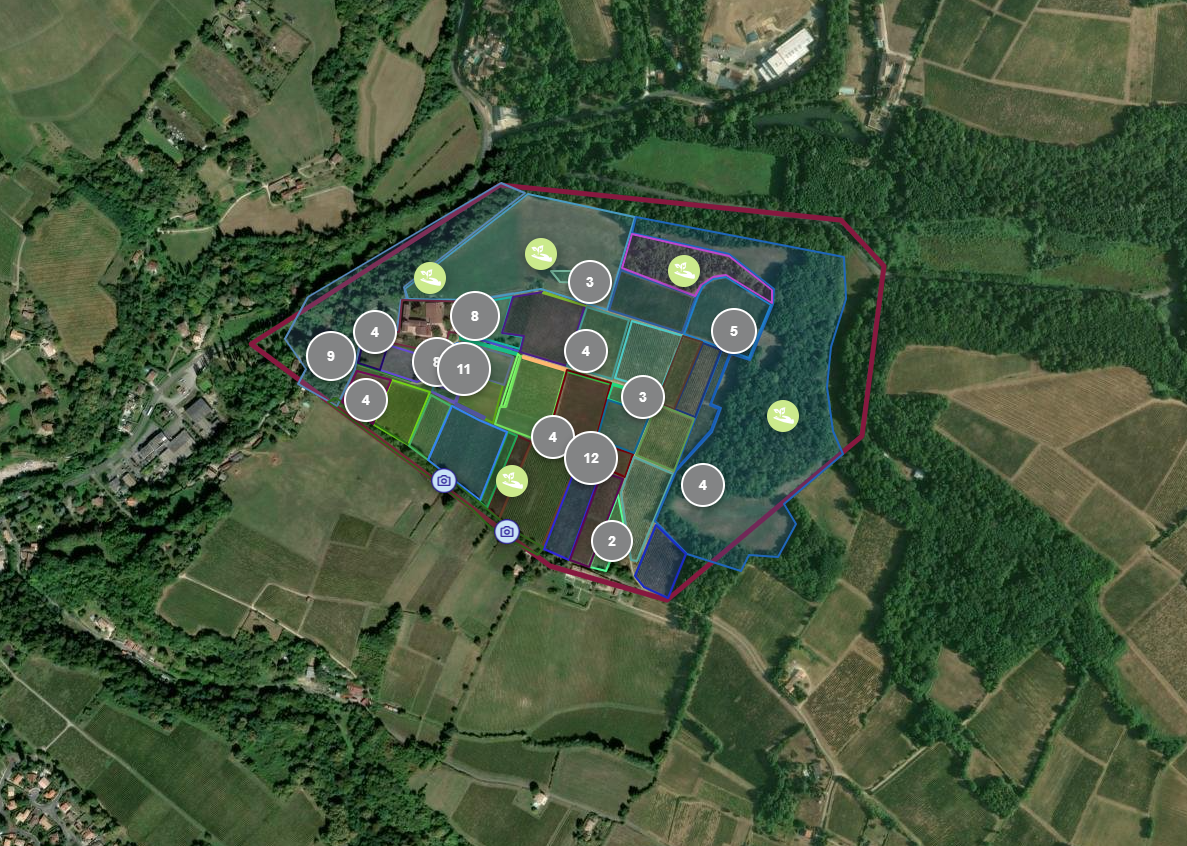
BioAtlas · Deployment
Interface déploiement capteurs
Deployment

A network of sensors on your site, for several months

Automatic trigger cameras, sound recorders for birds, ultrasonic detectors for bats. Multiple measurement points, 24/7, continuously.

Soil analyses on request — eDNA, flow cytometry
02
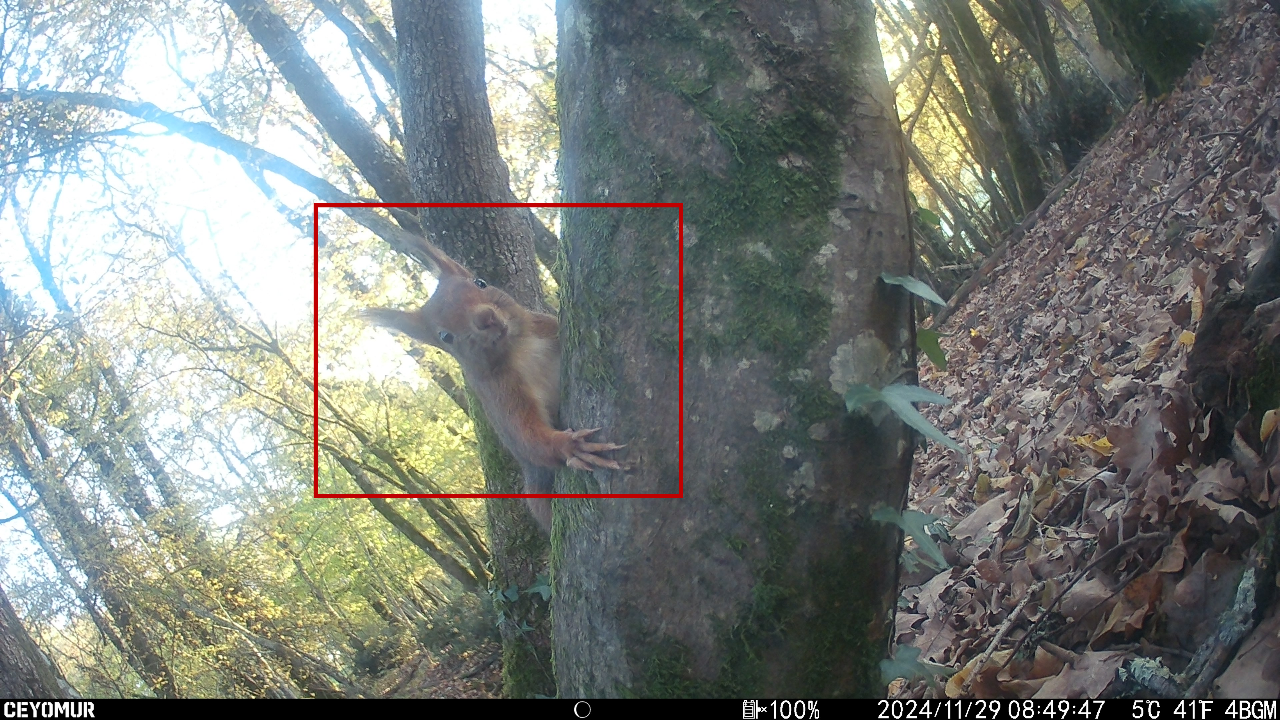
BioAtlas · AI Processing
Interface traitement IA
Processing

Automatic recognition, validation by our ecologists

Every image and sound is analysed by the reference algorithms (BirdNET, Kaleidoscope), then checked and validated by an ecology engineer. Every detection is timestamped and geolocated.

Your data, accessible in real time on BioAtlas
03
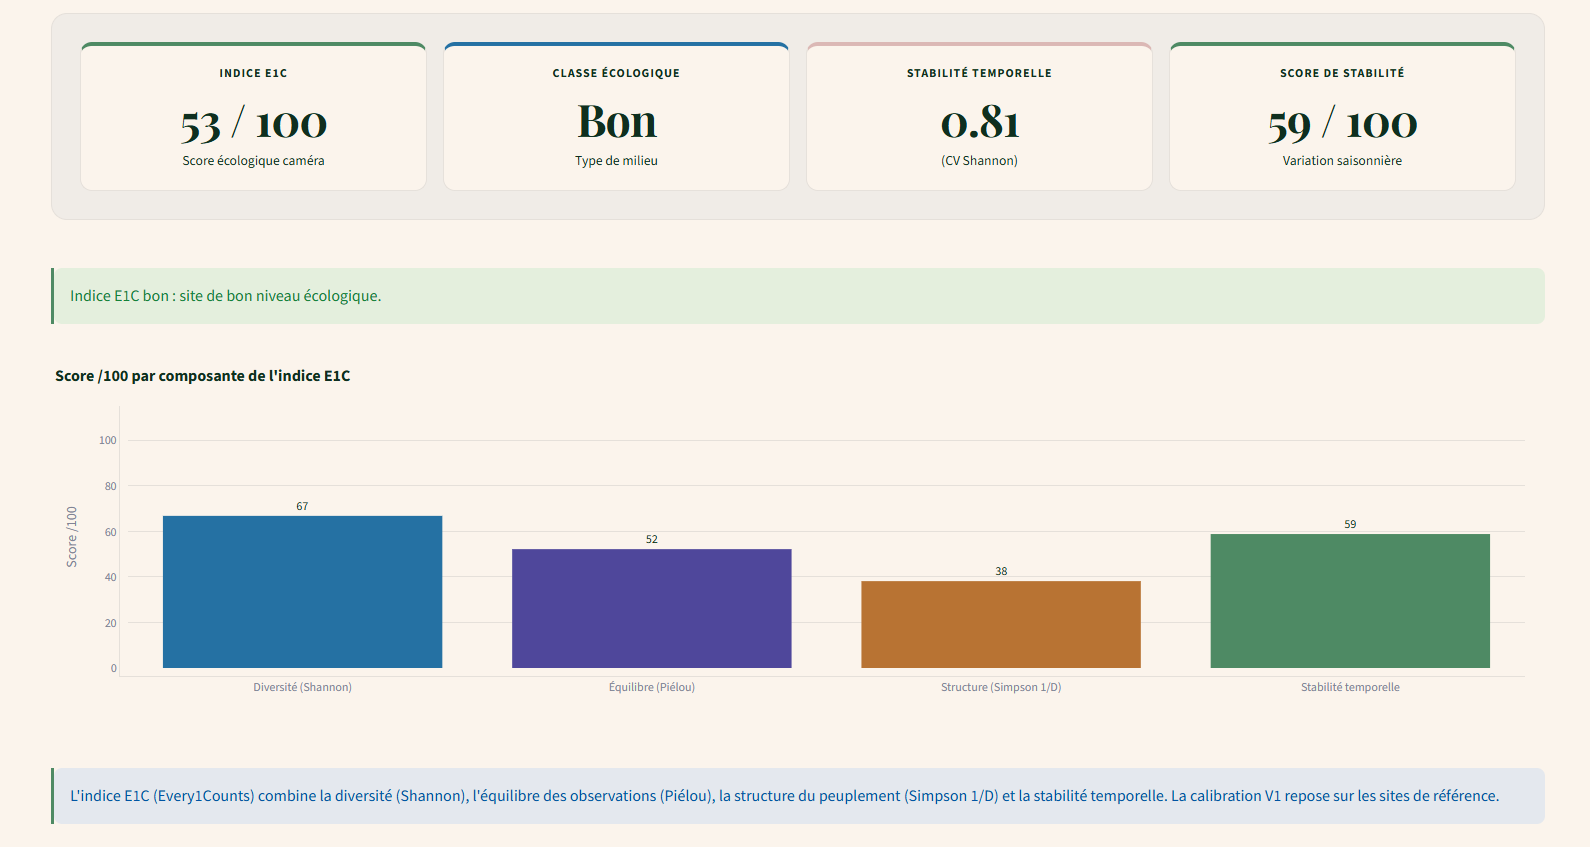
BioAtlas · Indicators
Interface indicateurs écologiques
Analysis

Ecological indicators, not a single score

Species richness, evenness, temporal stability, heritage species, impact of practices. Biodiversity is too complex for a single figure — we cross-reference several.

Compliant with IPBES recommendations and the European regulatory framework
04
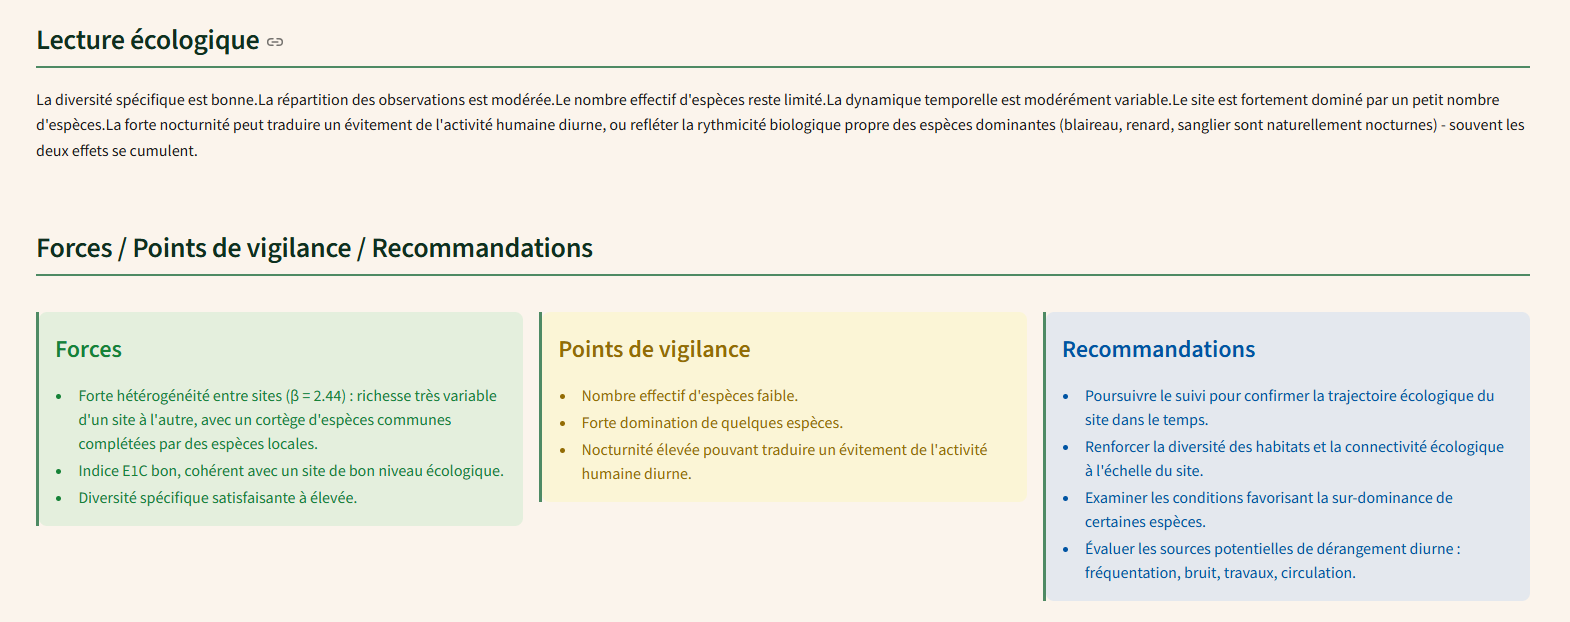
BioAtlas · Annual Report
Interface bilan Every1Counts
The deliverable

The Every1Counts Report — complete annual report

Species inventory, commented indicators, multi-year trends, watch points and management recommendations. Auditable, understandable, immediately usable.

CSRD · ERC · Environmental certifications · ESG Reporting
Our Methodology : cross-referencing landscape context, real practices and continuous field measurement — to link every action to its effect on living nature, and provide proof of it.

Three principles guide our work.

Our Methodology

Continuous measurement, clinical rigour, a single platform.

01 Continuous measurement

Continuous measurement, at several points, in several forms

Living nature doesn't stand still: a one-off measurement isn't enough to capture it.

See details

The naturalist inventory paints a precise picture of biodiversity at a given moment: a valuable starting point. But living nature varies with the weather, the seasons and the years, and is distributed differently from one habitat to another within the same site. To track this change and link each practice to its effect, this picture needs to extend over time: continuous measurement, over several months, at several points, and across several modes — image, sound, ultrasound, soil. The Observatory doesn't replace the inventory: it extends it and sets it in motion.

Because biodiversity:

  • is complex: several parameters must be measured and analysed together to describe the health of an ecosystem (IPBES, 2026);
  • varies over time: only continuous measurement over several months, using sensors, can offset the effects of weather, seasons or human activity;
  • varies across space: to obtain reliable indicators, biodiversity must be measured at several points on the site, to account for the diversity of habitats;
  • requires robust scientific data to produce reliable indicators that are comparable over time.
02 Clinical rigour

Clinical rigour

As in the field of health, we do not simply observe: we take samples, analyse them, and produce a structured diagnosis with recommendations. That is the logic behind the Every1Counts Report.

03 A single platform

All your data in one place

Each piece of data only makes full sense once linked to its context.

See details

Field measurement only makes full sense once linked to its context. The Observatory brings together on a single platform, BioAtlas, data from your sensors, data from the surrounding area and data from your site. Brought together in one place, they make it possible to cross-reference what you do with what living nature reveals, and to produce rigorous scientific analyses based on statistics.

  • Data from your sensors — images, sounds, ultrasound, soil analyses.
  • Data from the surrounding area — mapping, satellite imagery, citizen science.
  • Data from your site — practices, infrastructure, existing naturalist inventories.
Bébé renard Buse en vol Chacal doré Chacal dans la neige Chouette hulotte Cochon d'Inde sauvage Écureuil en forêt Faisan Genette commune Lièvre Martre la nuit Oiseau au soleil
The clinical approach

The rigour of a health check, applied to your ecosystem.

In the field of health, observing a patient is not enough: samples are taken, analysis is carried out, and a structured report with recommendations is produced. Every1Counts applies that same rigour to the living nature of your site.

The subject
Your site
Vineyards, meadows, forests, brownfields, peri-urban areas…
The laboratory
Every1Counts
Ecology engineers, data scientists, scientifically validated protocols
The samples
La captation image & son
Cameras, sound recorders, ultrasonic detectors, soil analyses
The health check
The Every1Counts Report
Annual report: inventoried species, diversity indicators, trends, recommendations
Observatory sites

Our monitored sites.

15 sites · 173 measurement points · 1,847 ha · 665,949 observations
Observatory sites
Viticulture
Garden
Industrial land
Hospitality
Sylviculture
Anonymised site — name and photos hidden

Click on a marker to see observations from the site.

Who is this for?

In the territories where people and the living world continue to thrive together.

Farms joining the Observatory choose a scientific approach to their biodiversity: continuous data, rigorous protocol, verifiable results over time. If you have environmental commitments and want to link them to genuinely measurable effects on living nature, the Observatory is made for you.

Renard dans les vignes
Viticulture
Committed wine estates

Organic, HVE, CSR initiatives. Biodiversity as scientific proof of your commitment — valuable for export and with buyers.

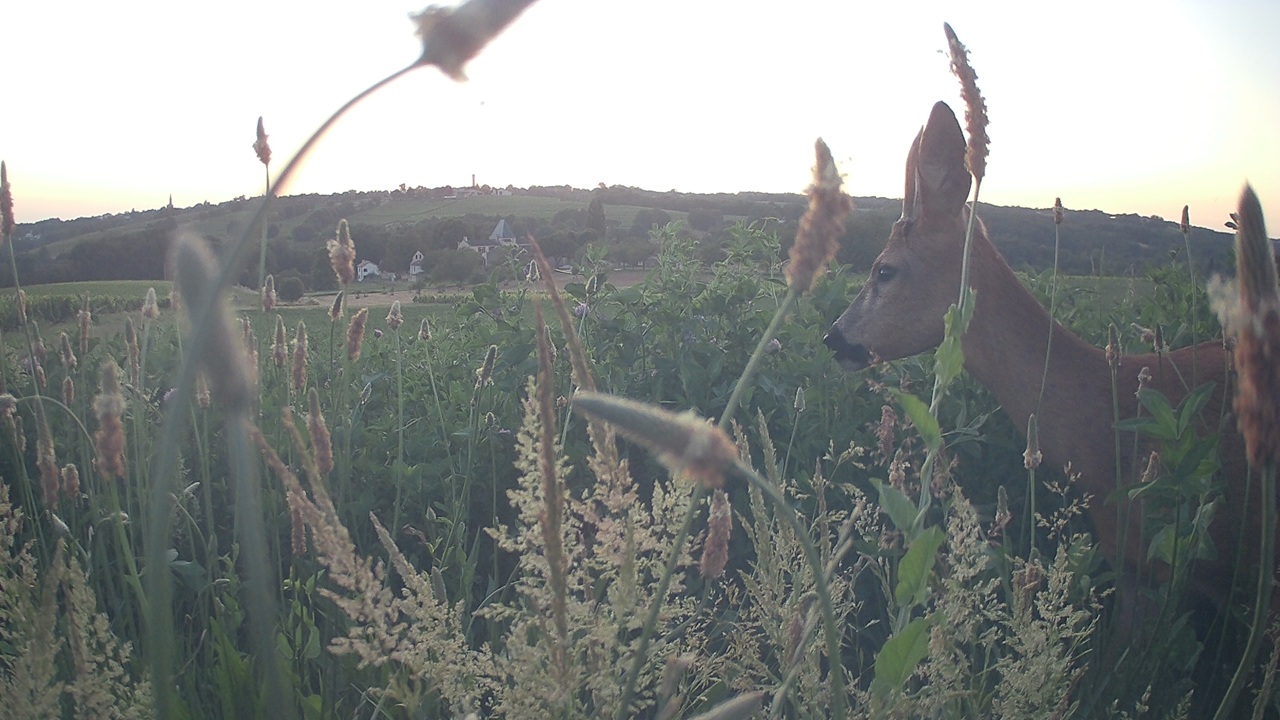
Chevreuil au Château
Agriculture & sylviculture
Agricultural and forestry holdings

Identify imbalances, measure the impact of practices, meet CSRD requirements and sustainable supply chains.

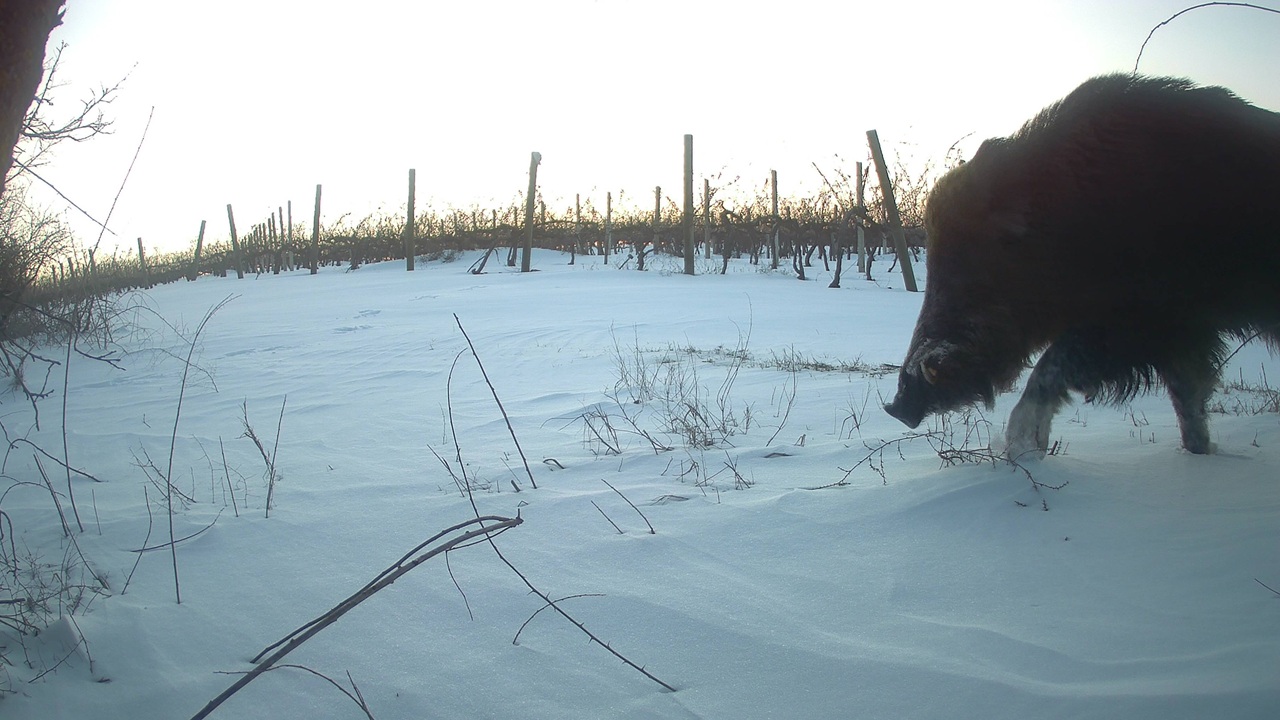
Sanglier dans la neige
Industrial land
Industrialists, developers, property companies

Brownfields, industrial sites, business zones. ERC and CSRD regulatory obligations, pressure from buyers and investors.

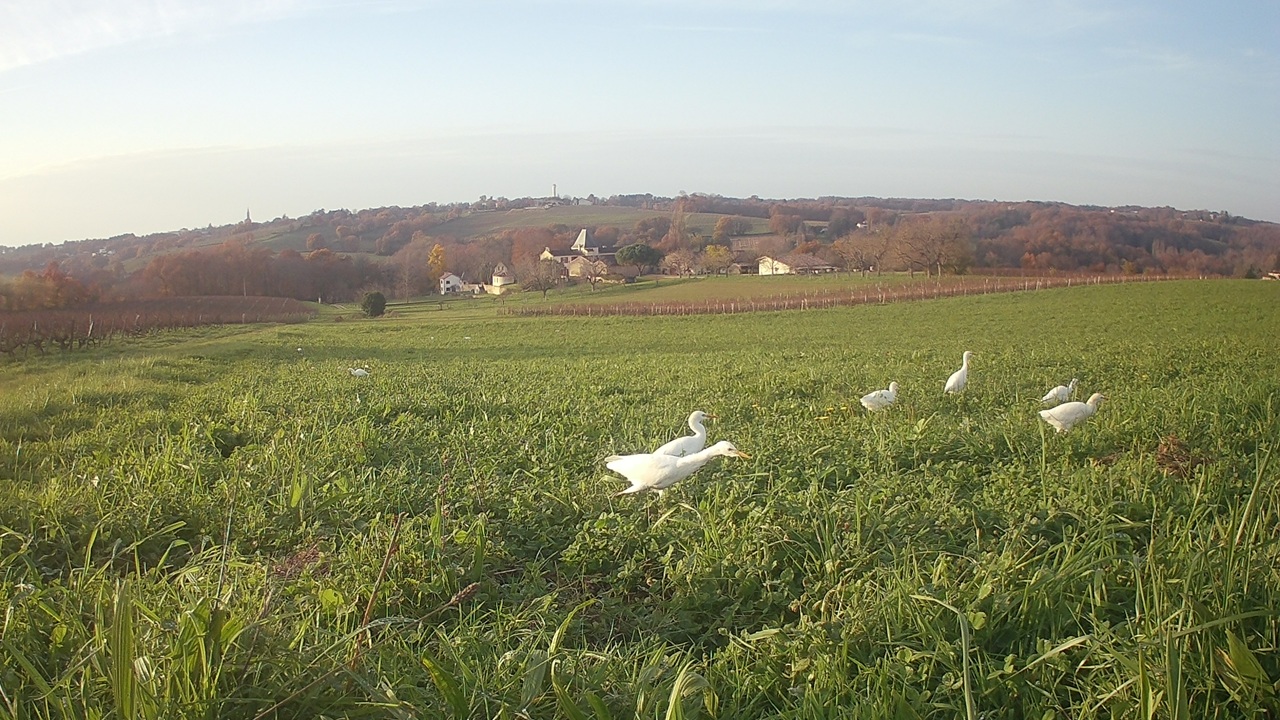
Héron garde-bœuf
Sustainable tourism
Hotels, estates, nature parks

Environmental labels, traveller expectations, territorial policy. Local wildlife as an asset and proof of your commitment.

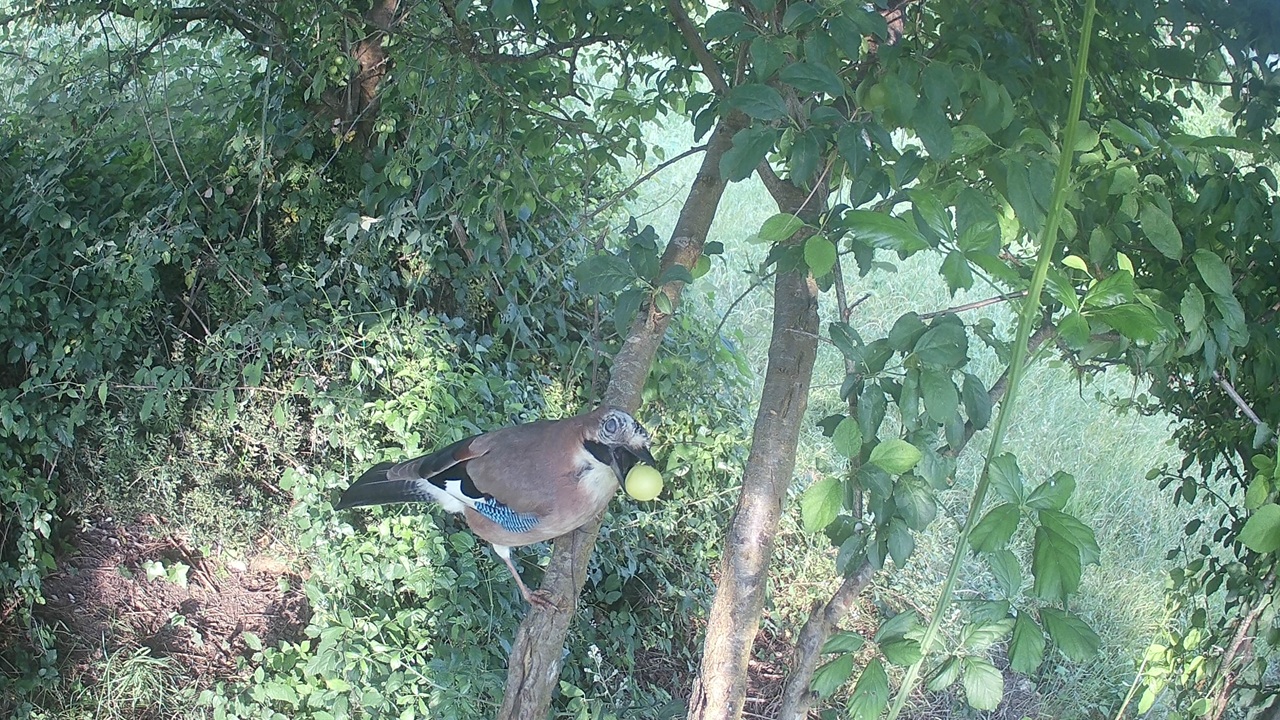
Geai des chênes
Peri-urban local authorities
Municipalities, inter-municipal bodies

ZAN, green and blue infrastructure, PCAET, public consultation. Objective data for your local plans and environmental reports.

Your sector isn't listed? Every site is unique. Let's talk.

Contact us →
Beyond your site

The observatory to see far, together

ERC

The measurement that lasts thirty years

Offsetting 30-year monitoring Auditable proof

Avoid, Reduce, Offset: the monitoring obligation can run for thirty years — a one-off inventory is not enough.

See details

When a development triggers offsetting measures, the monitoring obligation does not stop once construction is complete: it can run for thirty years. It requires continuous measurement, comparable from one year to the next, able to demonstrate that the offset is genuinely working, and to prove it to the authorities, your investors and local residents.

The Every1Counts Observatory constitutes this ecological record: baseline state from the first year, then progress over the entire duration of the obligation, with timestamped, geolocated and auditable data.

Export & industry

Your buyers will ask for it

Export Listing Specifications

Your clients now expect proof rather than declarations, especially for export.

See details

The pressure no longer comes solely from regulation. It comes from your clients: retailers, wholesalers, brands, importers. All of them are tightening their environmental requirements. For an estate focused on export, measured biodiversity becomes a commercial argument and, increasingly, a listing criterion.

The Observatory gives you that proof: robust scientific indicators, verifiable by a third party, ready to be built into your industry specifications. You don't just endure the requirement — you turn it into a differentiator.

An observatory backed by the industry

Biodiversity is not measured alone

Trade associations Industry partnerships

Every1Counts works with the organisations that structure the wine, agricultural and environmental sectors.

See details
Were you referred to the Observatory?

If your trade association, group or partner recommended Every1Counts, you're in the right place. Let's talk about your site.

Contact us →
Do you structure an industry?

Trade association, union, cooperative, consultancy, certifier: let's build together an offer suited to your members, to make measured biodiversity a shared, comparable and auditable standard.

Become a partner →
Captured on one of our Observatory sites
The Observatory, at your scale

Three ways to enter the Observatory.

From the first assessment to monitoring your entire portfolio.

Discovery

Start by seeing
3 months
A complete assessment of one of your sites, before committing for the long term.
What's included
Sensor network deployed
First species report
Biodiversity indicators
Recommended

Ongoing

The Observatory over time
From 12 months
Monthly fee decreases with the length of commitment — 12, 36 or 60 months.
Everything in Discovery, plus:
Continuous monitoring + BioAtlas platform
Support from our ecologists
Impact analyses included from 36 months

Multi-site

At the scale of your portfolio
Bespoke
For groups, property companies and multi-estate operations.
Everything in Ongoing, plus:
Consolidated management of several sites
Volume-based pricing
A single point of contact
+ In additionÀ la carte, based on your needs
Soil analyses — eDNA and flow cytometry
Bat detection — ultrasonic sessions in the warm season
Full Service — we handle sensor collection on your behalf (on quote)

Every site is unique: the number of measurement points depends on your surface area and habitats. We prepare your quote after an initial conversation.

Request a quote
See more observations and publications